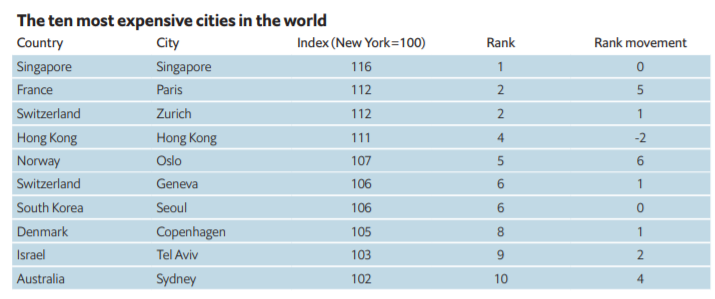
In 2018 Singapore retains its title as the world’s most expensive city for the fifth consecutive year in a top ten that is largely split between Asia and Europe. Seoul is the only other city in the top ten that has maintained its ranking from the previous year. In the rest of Asia, Hong Kong and Sydney join Singapore and Seoul in the top ten. Low inflation has pushed Tokyo and Osaka out of the top ten in the cost of living ranking covering 133 cities worldwide.
Despite topping the ranking, Singapore still offers relative value in some categories, especially compared with its regional peers. For categories such as personal care, household goods and domestic help Singapore remains significantly cheaper than its peers, but it remains the most expensive place in the world to buy and run a car and the third-priciest destination in which to buy clothes.

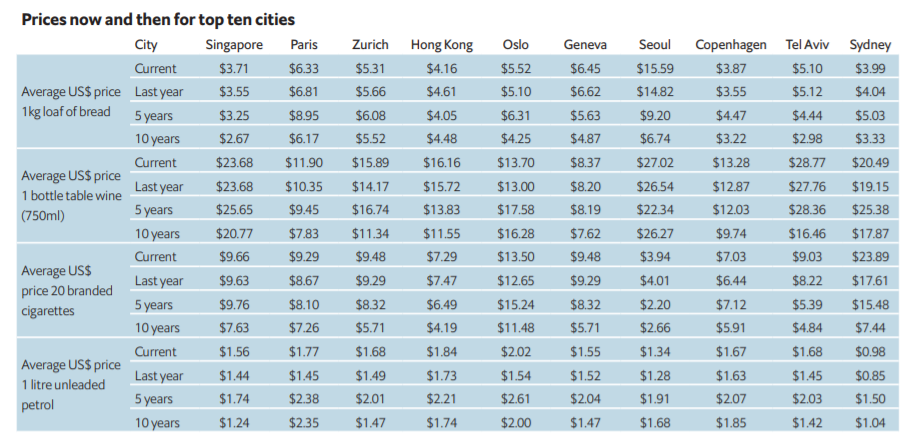
In terms of food and drink, the cost of living in Singapore is on a par with that of Shanghai in China. Seoul, Tokyo and Hong Kong are the three most expensive places in the world to buy staple goods. In Seoul, topping up a grocery basket is almost 50% more expensive than in New York.

The Japanese capital, which was the world’s most expensive city until 2013, has moved seven places down the ranking in the past 12 months. Conversely, Seoul, which was ranked 21st five years ago, is now in the sixth position.
Tel Aviv, which was ranked 34th just five years ago, is now the ninth most expensive city in the survey. Currency appreciation played a part in this rise, but Tel Aviv also has some specific costs that drive up prices, notably those of buying, insuring and maintaining a car, which push transport costs 79% above New York prices. Tel Aviv is also the second most expensive city in the survey in which to buy alcohol.
Within western Europe, it is non-euro area cities that largely remain the most expensive. Zurich (2nd), Oslo (5th), Geneva (6th) and Copenhagen (8th) are among the ten priciest. The lone exception is Paris (2nd), which has featured among the top ten most expensive cities since 2003. With west European cities returning to the fold, the region now accounts for three of the five most expensive cities and for one-half of the top ten. Asia accounts for a further four cities, while Tel Aviv is the sole Middle Eastern representative.
New York has moved four places down the ranking to 13th position owing to a weakening of the US dollar in 2017, which has also affected the position of other US cities. This, however, still represents a comparatively sharp increase in the relative cost of living compared with five years ago, when New York was ranked 27th.
Last year deflation and devaluations were prominent factors in determining the cost of living, with many cities moving down the ranking owing to currency weakness or falling local prices. Both prices and a number of currencies rallied during 2017, and although inflation in many cities has remained moderate, the impact is reflected in the average cost of living. Taking an average of the indices for all cities surveyed using New York as base city, the global cost of living has risen to 74%, up slightly from 73% last year.
This remains significantly lower than five years ago when the average cost of living index across the cities surveyed was 85.5%.
The Worldwide Cost of Living is a biannual Economist Intelligence Unit survey that compares more than 400 individual prices across 160 products and services. These include food, drink, clothing, household supplies and personal care items, home rents, transport, utility bills, private schools, domestic help and recreational costs.
The survey itself is a purpose-built Internet tool designed to help human resources and finance managers calculate cost-of-living allowances and build compensation packages for expatriates and business travellers. The survey incorporates easy-to-understand comparative cost-of-living indices between cities. The survey allows for city-to-city comparisons, but for the purpose of this report all cities are compared with a base city.
you’d like to contribute your story to us, drop us an email at editors@sureboh.sg and we’ll review it. We read each submission that comes to us within two weeks of receiving it.


